CloudTrail vs. CloudWatch: The AWS Monitoring Question Every SAA-C03 Candidate Gets Wrong
AWS CloudTrail and CloudWatch both 'watch' your AWS environment — but they answer completely different questions. Master the distinction and never lose a monitoring or auditing question on the SAA-C03 or DVA-C02 again.
Here is the scenario you will see on the SAA-C03:
A company's security team discovers that an S3 bucket containing sensitive data has been deleted. The team needs to identify which IAM user or role deleted the bucket, what time the deletion occurred, and from which IP address the API call originated. Which AWS service provides this information?
Four answer choices: CloudWatch Logs. CloudTrail. CloudWatch Events. AWS Config.
The correct answer is CloudTrail — but this is the same question that trips up candidates who've memorized that both services "monitor your AWS environment." They do, but they watch completely different things. One watches what's happening; the other watches who did it.
This post gives you the mental model, the event-type breakdown, the comparison table, and the scenario drills that make CloudTrail vs. CloudWatch a reliable source of correct answers on the SAA-C03 and DVA-C02 — instead of a coin flip.
The One-Sentence Mental Model
Write this down:
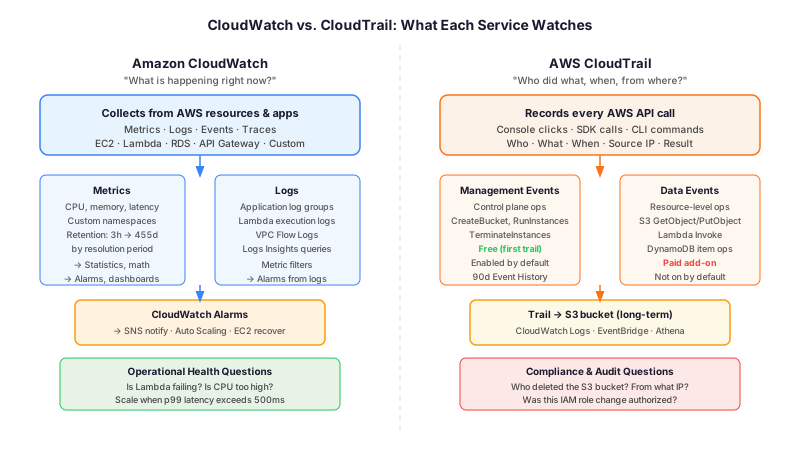
CloudWatch tells you WHAT is happening to your resources. CloudTrail tells you WHO is doing things to your account.
CloudWatch watches performance, health, and operational state. CloudTrail records every API call — the audit trail of human and machine actions.
If the exam scenario involves metrics, alarms, dashboards, application logs, or automatic scaling — that's CloudWatch. If it involves API history, finding out who changed a configuration, meeting a compliance requirement, or investigating a security incident — that's CloudTrail.
That distinction alone resolves roughly 80% of monitoring/auditing questions. The remaining 20% come from knowing both services deeply enough to recognize the traps.
Amazon CloudWatch: What It Is and What It Watches
Amazon CloudWatch is AWS's unified observability service. It collects operational data — metrics, logs, and events — from across your AWS resources and applications, and lets you visualize, alarm on, and act on that data.
CloudWatch Metrics
Every AWS service publishes metrics to CloudWatch automatically — CPU utilization on EC2, request count and latency on API Gateway, error rates on Lambda, storage bytes on S3. These are the numbers that describe what your infrastructure is doing right now.
Key metric properties to know for the exam:
- Namespaces: Metrics are organized into namespaces per service (
AWS/EC2,AWS/Lambda,AWS/RDS). Custom application metrics go in a custom namespace you define. - Dimensions: Name/value pairs that identify the source — for EC2, dimensions are
InstanceId,AutoScalingGroupName,InstanceType. A metric with different dimension values is a different time series. - Retention by resolution: Standard resolution metrics (1-minute granularity) are retained for 15 days; 5-minute metrics for 63 days; 1-hour metrics for 455 days. High-resolution metrics (1-second granularity) are kept for 3 hours. The exam does not require memorizing these exactly, but knows that CloudWatch metrics are not stored forever — they age out.
- Basic vs. Detailed Monitoring: EC2 instances publish metrics every 5 minutes by default (Basic Monitoring, free). Detailed Monitoring sends them every 1 minute for an additional charge. If an exam scenario says "the team needs metrics updated every minute," Detailed Monitoring is the answer.
CloudWatch Alarms
Alarms evaluate a metric against a threshold and trigger actions when the metric breaches. Three alarm states: OK, ALARM, and INSUFFICIENT_DATA.
Alarm actions the exam tests:
- SNS notification — alert an email list, a Slack webhook, or an SQS queue
- Auto Scaling action — add or remove EC2 instances when a metric crosses a threshold
- EC2 action — stop, terminate, reboot, or recover an EC2 instance based on a system-level check
- Step scaling / simple scaling / target tracking — the three Auto Scaling policy types, all driven by CloudWatch alarms or target-tracking metrics
The exam loves the pattern: "CloudWatch Alarm → SNS topic → Lambda function." That's the serverless alerting chain for operational events.
CloudWatch Logs
CloudWatch Logs collects and stores log data from applications, Lambda functions, EC2 instances (via the CloudWatch Agent), ECS containers, and other sources. Key concepts:
- Log groups: The top-level organizational unit, typically one per application or Lambda function
- Log streams: Individual sequences of log events within a log group (one per Lambda instance, one per EC2 instance)
- Metric filters: Turn patterns in log data into CloudWatch metrics — for example, count occurrences of "ERROR" in an application log and emit a custom metric
- Logs Insights: An interactive query tool for searching and analyzing log data using a SQL-like syntax. If an exam scenario says "analyze log data with queries," Logs Insights is the answer.
- Subscriptions: Stream log data in near-real-time to Kinesis Data Streams, Kinesis Firehose, or Lambda for downstream processing
Lambda automatically writes execution logs to CloudWatch Logs — no agent required. This makes CloudWatch Logs the default tool for debugging Lambda function behavior on the DVA-C02.
CloudWatch Events / EventBridge
A note on naming: CloudWatch Events has been replaced by Amazon EventBridge for new use cases. The two share the same underlying infrastructure, and exam questions may refer to either name. EventBridge is the service to choose for new architectures; CloudWatch Events is the legacy name you'll still see in older question pools.
EventBridge watches for events from AWS services (EC2 state changes, S3 bucket notifications, etc.) and routes them to targets (Lambda, SNS, SQS). If a question mentions "trigger a Lambda function when an EC2 instance is terminated," the answer is EventBridge (CloudWatch Events), not CloudTrail.
AWS CloudTrail: What It Is and What It Records
AWS CloudTrail is your account's API audit log. Every time any principal — an IAM user, an IAM role, an AWS service acting on your behalf, a root account login — makes an API call, CloudTrail records a structured event with:
- Who: the identity (
userIdentityfield — IAM user ARN, role ARN, federated user, AWS service) - What: the API call (
eventName—CreateBucket,TerminateInstances,AttachRolePolicy) - When: a precise timestamp (
eventTime) - Where: the source IP address (
sourceIPAddress) and AWS region (awsRegion) - Result: whether the call succeeded or was denied (
errorCode,errorMessageon failure) - Context: the resources affected, the request parameters, and the response elements
This is the data an auditor, a security team, or a forensics investigator needs. It is the answer to "prove to our compliance auditor that no one touched the production database outside of approved change windows."
The Three CloudTrail Event Types
This is one of the most tested CloudTrail details on the SAA-C03. The exam tests not just that CloudTrail has event types, but which are on by default and which cost extra.
Management Events (Control Plane Events)
Management events record operations on AWS resources — the create, modify, and delete operations that change the configuration of your account.
Examples: RunInstances, TerminateInstances, CreateBucket, DeleteBucket, CreateUser, AttachRolePolicy, AuthorizeSecurityGroupIngress, ModifyDBInstance.
Key exam facts:
- Enabled by default for the first Trail in each region — management events are recorded automatically
- Free for the first Trail in each region (additional Trails that deliver the same management events incur a per-event charge)
- Read events vs. write events: Management events are further split. You can choose to record read-only events (Describe*, Get*, List*), write-only events (Create*, Delete*, Update*, Modify*), or both. This is a cost optimization and noise-reduction tool.
Data Events (Data Plane Events)
Data events record resource-level operations — the individual reads and writes inside a resource rather than management of the resource itself.
The three data event categories the exam tests:
- S3 object-level operations:
GetObject,PutObject,DeleteObject,CopyObject. These fire for every object access — on a busy S3 bucket this can be millions of events per hour. - Lambda function invocations: Every
InvokeAPI call against a Lambda function, whether from the console, a CLI call, an API Gateway, or an event source. - DynamoDB item-level operations:
PutItem,GetItem,UpdateItem,DeleteItem,BatchWriteItem, etc.
Key exam facts:
- Not enabled by default — you must explicitly configure data events on a Trail
- Paid: approximately $0.10 per 100,000 events (verify current pricing at aws.amazon.com/cloudtrail/pricing)
- Volume warning: Data events on a high-traffic S3 bucket or a frequently-invoked Lambda function can generate enormous event volumes — and costs — if enabled without selective filtering
The exam signal for data events: "The team needs to know every time a specific Lambda function is invoked" or "prove which user accessed this specific S3 object" — those are data events, not management events.
CloudTrail Insights Events
Insights events detect unusual API activity — for example, an IAM role that normally calls CreateUser zero times per hour suddenly calling it 50 times, which might indicate a compromised credential. Insights continuously analyze your management events (and as of November 2025, data events too) and surface anomalies.
Key exam facts:
- Optional, paid add-on: approximately $0.35 per 100,000 events analyzed
- Use case: automated detection of potential security incidents without manual threshold tuning
- Not a replacement for GuardDuty — Insights fires on API-call-volume anomalies; GuardDuty does broader threat intelligence including VPC Flow Log and DNS analysis
CloudTrail Event History: The Free 90-Day Window
Before you create a Trail, CloudTrail already gives you 90 days of management events in the Event History in the AWS console. This is always on, always free, and requires no configuration.
You can search Event History by event name, resource type, resource name, IAM user, and time range. For a quick "who deleted this Security Group yesterday?" question, Event History is the fastest answer — no Athena query needed.
The limits: 90 days only, management events only, no S3 export, no programmatic querying at scale. For anything beyond that, you need a Trail.
Creating a Trail: Long-Term Storage and Analysis
A Trail is a configuration that delivers CloudTrail events to an S3 bucket for long-term storage. Trails enable:
- Retention beyond 90 days — keep events as long as your S3 lifecycle policy allows
- Cross-region and multi-account aggregation — a trail can cover all regions and all accounts in an AWS Organization, feeding a central security S3 bucket
- Athena analysis — query CloudTrail JSON logs with SQL using Athena, without loading data into a database
- CloudWatch Logs integration — stream CloudTrail events into a CloudWatch Logs group for real-time metric filters and alarms (the CloudTrail + CloudWatch combination)
- EventBridge integration — trigger automated responses to specific API calls
The Master Comparison Table
| Dimension | Amazon CloudWatch | AWS CloudTrail |
|---|---|---|
| Primary question answered | What is happening? How much? | Who did it? When? From where? |
| Data type | Metrics, logs, events | API call records (structured JSON) |
| Sources | AWS service metrics, application logs, custom metrics | Every AWS API call, console action, CLI command |
| Default behavior | Basic metrics enabled per service; Detailed Monitoring off | Management events on; Data events off |
| Retention | Metrics: 3h–455d by resolution; Logs: configurable | Event History: 90d free; Trail: S3 lifecycle |
| Cost model | Free tier + per GB logs/custom metrics | First Trail free; Data events ~$0.10/100k; Insights ~$0.35/100k |
| Alerting | CloudWatch Alarms → SNS/Auto Scaling/EC2 actions | Via integration: CloudTrail → CW Logs → CW Alarm → SNS |
| Query/analysis | Logs Insights (SQL-like), metric math | Event History console; Athena for S3 Trail data |
| Primary exam domains | Performance optimization, resilience, Auto Scaling | Security & compliance, incident investigation |
| Covers "who" questions? | No | Yes |
| Covers "how much" questions? | Yes | No |
| Services most tested together | EC2, Lambda, RDS, API Gateway | IAM, S3, EC2, any "audit requirement" scenario |
Scenario Walkthroughs
Scenario 1: The Deleted S3 Bucket
A company's security team discovers that a production S3 bucket containing sensitive financial data was deleted. The CISO wants to know which IAM user or role deleted the bucket, the exact time, and the source IP address. What should the solutions architect check?
Correct answer: AWS CloudTrail — specifically, search Event History or the CloudTrail Trail for the DeleteBucket management event.
How to reason through it:
- "Who deleted it?" is an audit question — WHO performed an API action. This is the defining CloudTrail question. CloudWatch has no concept of IAM identity.
- CloudWatch would tell you that the bucket's storage metrics dropped to zero, or that requests to the bucket began returning 404 — but it cannot tell you which user made the API call.
- CloudTrail Event History records management events (including
DeleteBucket) for the last 90 days by default. Search forDeleteBucket, filter by the bucket name, and the event record shows the IAM principal, time, and source IP. - If the event was more than 90 days ago, or the team needs to cross-reference with other accounts, a Trail delivering to S3 + Athena provides the same data with no retention limit.
Trap: "The team should check CloudWatch Logs" is a plausible-sounding distractor. CloudWatch Logs stores application logs that your code writes — it does not receive AWS API calls unless you've explicitly configured a CloudTrail Trail to stream into a CloudWatch Logs group.
Scenario 2: CPU Alarm for Auto Scaling
An e-commerce application experiences traffic spikes during flash sales. The DevOps team wants to add EC2 instances automatically when average CPU utilization across the Auto Scaling group exceeds 70% for 3 consecutive minutes. Which service should they configure?
Correct answer: Amazon CloudWatch — create a CloudWatch Alarm on the CPUUtilization metric for the Auto Scaling group and attach a scale-out policy.
How to reason through it:
- "CPU utilization exceeds 70%" is a metric threshold — WHAT is happening to the resources. This is CloudWatch's job.
- CloudTrail records no metrics. It has no concept of CPU or thresholds. Even if you could query it, it has no alarm mechanism.
- A CloudWatch Alarm evaluates the
CPUUtilizationmetric from theAWS/EC2namespace, filtered by the Auto Scaling group dimension. When it breaches the threshold for the specified evaluation periods, it triggers the Auto Scaling scale-out policy. - The correct chain: EC2 → publishes
CPUUtilizationmetric to CloudWatch → CloudWatch Alarm evaluates threshold → Alarm state ALARM → Auto Scaling group adds instances.
Trap: Some candidates confuse CloudWatch Events (EventBridge) with CloudWatch Alarms. CloudWatch Events/EventBridge fires on state changes and scheduled patterns — not on metric thresholds. Metric-threshold alerting and scaling is always a CloudWatch Alarm, not an EventBridge rule.
Scenario 3: Security Alert on Root Account Login
A company's security policy states that the AWS root account must never be used for any action. The security team wants to be immediately notified by email any time the root account logs in to the console or makes an API call. How should the solutions architect implement this?
Correct answer: CloudTrail + CloudWatch Logs + CloudWatch Alarm + SNS
This is the combined use pattern the exam loves. Neither service alone is sufficient.
The architecture:
- CloudTrail Trail → sends management events to a CloudWatch Logs group (you configure this when creating or updating a Trail)
- CloudWatch metric filter → watches the CloudTrail log group for events where
userIdentity.type = "Root"andeventType = "AwsConsoleSignIn"(or any root API call) - CloudWatch metric filter increments a custom metric every time a matching event appears
- CloudWatch Alarm → threshold of ≥1 on that custom metric over a 1-minute window → state
ALARM - SNS topic → receives the alarm notification → emails the security team
How to reason through it:
- CloudTrail is the source of truth for "who logged in" — it captures
ConsoleLoginevents withuserIdentity.type = Root. CloudWatch alone cannot detect a root login because it has no access to IAM identity context. - CloudWatch is the alerting layer — it can set thresholds and notify via SNS. CloudTrail alone cannot send email notifications; it has no alarm mechanism.
- The pattern "CloudTrail → CloudWatch Logs → metric filter → alarm → SNS" is a standard AWS security architecture and explicitly mentioned in the AWS Security Best Practices whitepaper. GuardDuty also detects root account usage, but the exam question specifically asks about "notify via email" — that chain runs through CloudWatch Alarms + SNS.
This scenario is frequently used in SAA-C03 practice questions because it tests that you understand both services are needed and can connect them in the right order.
Scenario 4: Lambda Error Rate Spike
A serverless application running on AWS Lambda is experiencing intermittent failures. The development team wants to see the error rate over the past 24 hours and configure an alert if the error rate exceeds 5% for more than 2 minutes. Which AWS services should they use?
Correct answer: CloudWatch Metrics and CloudWatch Alarms.
How to reason through it:
- Lambda automatically publishes the
ErrorsandInvocationsmetrics to CloudWatch in theAWS/Lambdanamespace. No configuration required. - The error rate can be derived from
Errors / Invocationsusing CloudWatch metric math — no need to parse logs. - CloudWatch Logs captures Lambda execution logs for debugging individual failures. Logs Insights can query those logs over the 24-hour window.
- CloudTrail records Lambda
InvokeAPI calls — but it records that invocations happened, not whether they succeeded or what error code the function returned. CloudTrail has no concept of Lambda runtime errors.
Trap: Some candidates assume they need to check CloudTrail for Lambda failures because CloudTrail covers Lambda invocations as data events. CloudTrail data events record the invocation at the API level (succeeded, failed, throttled) but not the function's internal error behavior. Internal function errors (unhandled exceptions, timeouts) are surfaced through CloudWatch metrics (Errors, Duration, Throttles), not through CloudTrail.
Common Exam Traps
Trap 1: Thinking CloudWatch Logs receives all AWS API calls.
CloudWatch Logs stores logs that services and applications write to it — Lambda execution output, EC2 application logs, VPC Flow Logs. AWS API calls go to CloudTrail, not CloudWatch Logs, unless you explicitly configure a CloudTrail Trail to deliver to a CloudWatch Logs group. The two are connected by configuration, not by default.
Trap 2: Thinking CloudTrail is enough to send an alert.
CloudTrail records events. It does not alarm, notify, or trigger any action on its own. To alert on a CloudTrail event, you must: (1) configure a Trail to deliver to a CloudWatch Logs group, (2) create a metric filter in CloudWatch Logs, (3) create a CloudWatch Alarm on that metric, and (4) attach an SNS notification. GuardDuty or Security Hub can also monitor for specific CloudTrail patterns, but the exam question "notify via SNS when X happens" always implies the CloudTrail → CW Logs → CW Alarm → SNS chain.
Trap 3: Assuming data events are always enabled.
CloudTrail data events (S3 object-level, Lambda invoke, DynamoDB item-level) are not enabled by default. If an exam scenario says "the team needs to know which user accessed this S3 object," the implied prerequisite is that S3 data events were enabled on a Trail. A scenario that asks "what should the team do to track S3 object access going forward?" is asking you to enable data events on a Trail — not just check Event History (which only has management events).
Trap 4: Using CloudWatch metrics for accountability investigations.
CloudWatch metrics show values over time but they are anonymous — they tell you CPU was 90% at 2:15 PM, but not why or who. For accountability, investigation, or compliance audit purposes, CloudTrail is required. An exam scenario that says "the compliance team requires proof of who modified this IAM policy" has only one answer: CloudTrail.
Trap 5: Confusing CloudTrail with AWS Config.
AWS Config records the state of your resources — what your EC2 instances, Security Groups, and S3 buckets looked like at any point in time, and what changed. CloudTrail records actions — the API calls that caused those changes. Both are used in compliance scenarios, and they complement each other: Config tells you what changed, CloudTrail tells you who changed it. An exam scenario asking "show the history of configuration changes to this Security Group" could reference either service, but "identify who made the change" always points to CloudTrail.
The same exam requires you to know the VPC security controls that these audit tools monitor. The Security Groups vs. NACLs guide covers the stateful vs. stateless firewall pair — the security configuration changes that CloudTrail records and CloudWatch Logs can alert on.
Trap 6: Thinking CloudTrail Event History lasts forever.
Event History is a free, always-on 90-day rolling window. After 90 days, those events are gone unless you have a Trail delivering to S3. For multi-year retention (common in financial services and healthcare compliance scenarios), the answer is a Trail → S3 bucket with appropriate lifecycle/retention policies.
Exam-Day Checklist: Monitoring and Auditing Questions
When a monitoring, auditing, or compliance scenario appears:
- Does the question ask WHO made an API call, who modified a resource, or which account performed an action? → CloudTrail. Every time.
- Does the question mention source IP address of an API call? → CloudTrail event record (
sourceIPAddressfield). - Does the question involve metrics, thresholds, CPU/memory/latency? → CloudWatch Metrics and Alarms.
- Does the question mention triggering Auto Scaling or EC2 recovery? → CloudWatch Alarm with the appropriate action.
- Does the question ask about application logs or Lambda execution logs? → CloudWatch Logs, not CloudTrail.
- Does the question ask about querying or analyzing log data with something like SQL? → CloudWatch Logs Insights.
- Does the question say "meet a compliance requirement" or "audit trail"? → Almost always CloudTrail. May also involve AWS Config.
- Does the question involve S3 object-level access (GetObject, PutObject)? → CloudTrail data events (not on by default — must be enabled on a Trail).
- Does the question involve alerting on specific API calls (root login, security group change)? → CloudTrail + CloudWatch Logs metric filter + CloudWatch Alarm + SNS.
- Does the question ask about Lambda errors or function performance? → CloudWatch Metrics (
Errors,Duration,Throttles). NOT CloudTrail. - Does the question specify 90-day or shorter lookback? → CloudTrail Event History is sufficient. Longer → Trail to S3 required.
- Does the question ask about detecting unusual API activity automatically? → CloudTrail Insights (or GuardDuty for broader threat detection).
The Core Distinction You Cannot Afford to Forget
The entire topic resolves to a single axis:
CloudWatch answers "what is my infrastructure doing?" — metrics, alarms, logs, operational health. CloudTrail answers "who did something to my account?" — API calls, IAM identities, timestamps, source IPs.
They are not alternatives. They are complementary. A well-operated AWS account uses both: CloudWatch to keep services running efficiently, CloudTrail to keep the account auditable and secure. The exam tests whether you know which to reach for given a specific scenario trigger.
Know the three CloudTrail event types (management events free and on, data events paid and off, Insights paid and off). Know the 90-day Event History limit. Know the CloudTrail → CloudWatch Logs → Alarm → SNS chain for real-time alerting on audit events. And know the DVA-C02 angle: CloudWatch Logs for Lambda debugging, metric filters for custom application metrics, Logs Insights for ad-hoc log queries.
Drill This Until It's Automatic
Reading the distinction here is one step. Applying it correctly under a two-minute timer, when the exam is offering "CloudWatch Logs" as the answer to "who deleted the bucket," is another. That precision comes from practice with scenario questions that test both services together.
CertCoach generates SAA-C03 and DVA-C02 scenario questions on monitoring, security, and compliance, shows you per-domain scores so you can identify whether this specific topic is a gap, and lets you ask follow-up questions until the concept is solid rather than just familiar.
Start with the free 10-question diagnostic — no signup, no card — and see exactly where you stand on monitoring and security questions before exam day. When you're ready to drill deeper, the SAA-C03 practice question set covers both CloudTrail and CloudWatch in the Monitoring and Security domains with exam-difficulty scenarios.